
CO₂ emissions from Stroud homes
New government data has revealed how greenhouse gas emissions vary across different parts of the UK. The figures break emissions down by sector, including transport, industry and agriculture. For this blog, however, the most interesting insight is what they tell us about emissions from our homes.
The dataset also includes population figures, allowing us to compare household emissions on a per person basis across different regions.
Given Stroud’s reputation as one of the UK’s greener districts, the results are surprising. Our household emissions are only slightly lower than those in Scotland and Northern Ireland, despite both having significantly colder climates and therefore higher heating demands.
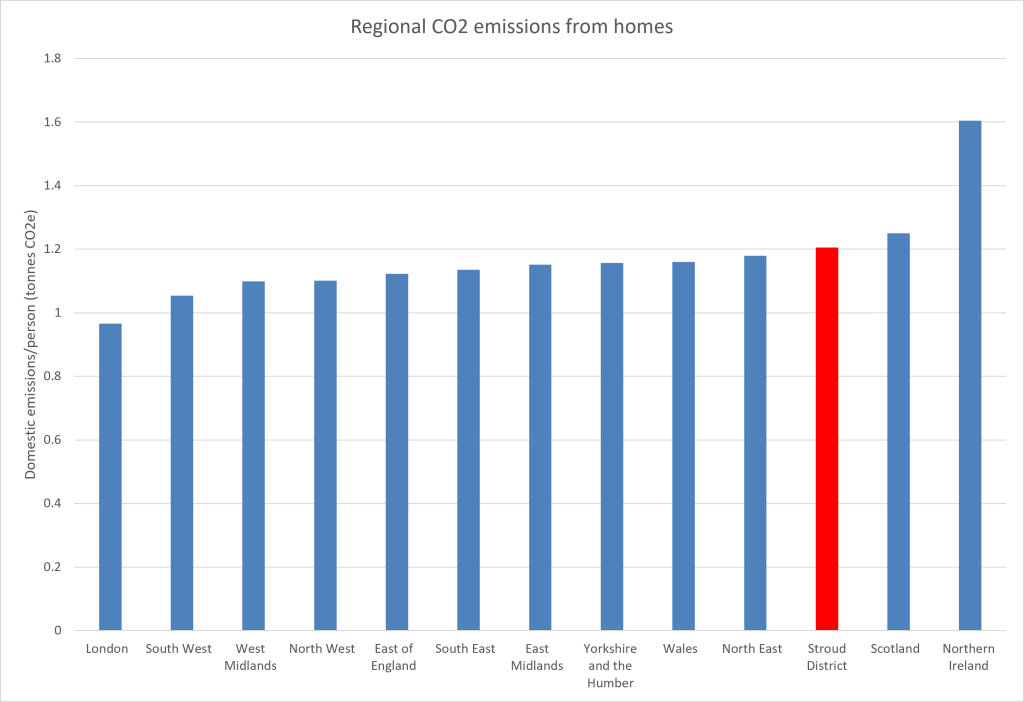
More concerning still, people in Stroud emit more CO₂ from their homes than the UK average. For a district that prides itself on environmental awareness, this is a reminder that good intentions alone are not enough. When it comes to reducing carbon emissions, there is still plenty of work to do.
What should we do?
The solution is clear: we need to make our homes more energy-efficient, more comfortable to live in, and cheaper to run. Fortunately, there are practical steps we can all take, and local support is here to help you take them –
- Visit the Transition Stroud Eco Homes Show on Tuesday 10 November at the Sub Rooms in central Stroud.
Local installers and experts will be showcasing energy-saving technologies and home improvement solutions, from insulation to low-carbon heating systems. Local energy and advice support will also be on offer from Severn Wye and Nailsworth CAN.
- Visit the Furbnow website for support to get a survey of your home, independent advice on the right upgrades, and a whole-house plan and design. Furbnow are partners with Gloucestershire councils.

Notes
Although the figures were published in 2026, they are based on source data from 2024. Allocating national greenhouse gas emissions to regional and local authority level is a complex process, which explains the delay. See the official statistics here: UK local authority and regional greenhouse gas emissions statistics